Monitoring the NTP Daemon using NTPQ

For my Raspberry Pi NTP server, one of the elements that I wanted was a status screen that showed NTP statistics. The simplest way I saw to do that was to query the data using the ntpq command.

The ntpq command provides multiple sub-commands that you can use to query the state of NTP. Examples of what can be read include:

  • Current Peer
  • Current Offset and Jitter
  • # of NTP Packets Sent

In my first effort, using Java, I executed the NTP command with the set of verbs that I wanted to retrieve data for.

private void updateNTPData() {
    try {
        Process process = new ProcessBuilder("ntpq", "-c", "iostats", "-c", "sysstats", "-c", "sysinfo", "-c", "peers").start();
        BufferedReader br = new BufferedReader(new InputStreamReader(process.getInputStream()));
        String line;
        boolean inPeers = false;
        while ((line = br.readLine()) != null) {
            // Process the lines...
        }
    } catch (IOException ioe) {
        ioe.printStackTrace(System.err);
    }
}

The part that I didn’t like about this is that it starts the process each time the data is polled. If I’m polling every 10 seconds, then that’s executing the ntpq process 6 times per minute, or some 8,640 times a day. I noticed that the ntpq command had an interactive mode. For my GoLang version, I decided that I would start the process in interactive mode and periodically send it commands.

var cmd = exec.Command("stdbuf", "--output=L", ntpqBinary, "-i")
// var cmd = exec.Command(ntpqBinary, "-i")
if cmd == nil {
    log.Fatal("exec.Command returned nil")
    panic("cmd is nil")
}
stdout, err := cmd.StdoutPipe()
if err != nil {
    log.Fatal(err)
    panic("Error getting stdout")
}
stin, err = cmd.StdinPipe()
if err != nil {
    log.Fatal(err)
    panic("Error getting stdin")
}

err = cmd.Start()

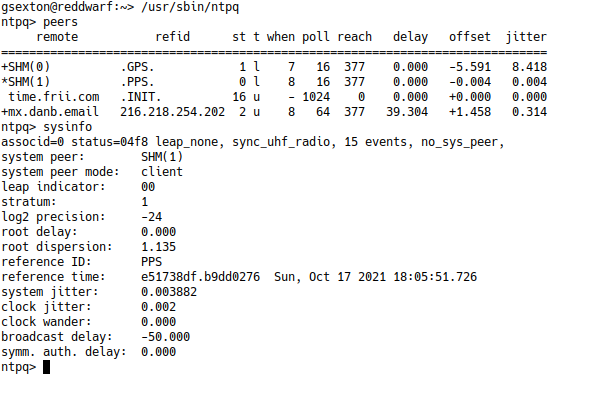
The one problem I noticed is that when I used the program on a Raspberry pi, the data wasn’t received. I figured out that the ntpq binary wasn’t flushing the data. I use stdbuf to reconfigure the stdout file descriptor. The -i flag at the end of the command starts ntpq in interactive mode. Here’s what it looks like when you run ntpq in interactive mode:
To send the command, I transmit the ntpq command to the stdin of the ntpq process:

_, err := io.WriteString(stdin, command+"\r\n") 

To read the input, I have a separate goroutine that collects the lines:

go func() {
    var scanner = bufio.NewScanner(stdout)
    defer func() {
        log.Println("NTPD Monitor - Closing NTPQ Channel")
        io.WriteString(stin, "exit\r\n")
        log.Println("NTPD Monitor - Exit sent")
        time.Sleep(2 * time.Second)
        stin.Close()
        stdout.Close()
        log.Println("NTPD Monitor - Sending kill")
        ntpCmd.Process.Kill()
        ntpCmd.Wait()
        ntpCmd = nil
        scanner = nil
    }()
    scanner.Split(bufio.ScanLines)
forloop:
    for scanner.Scan() {
        select {
        case ch <- scanner.Text():
        case <-closeChannel:
            break forloop
        }
    }
}()

As the scanner receives each line, it writes them to the channel. The parsing code then reads from the channel. While it may seem overkill to have a separate goroutine that just reads the data, it solves a problem. That problem is that if somehow the ntpq binary stops responding, the read routine won’t block indefinitely waiting for input.
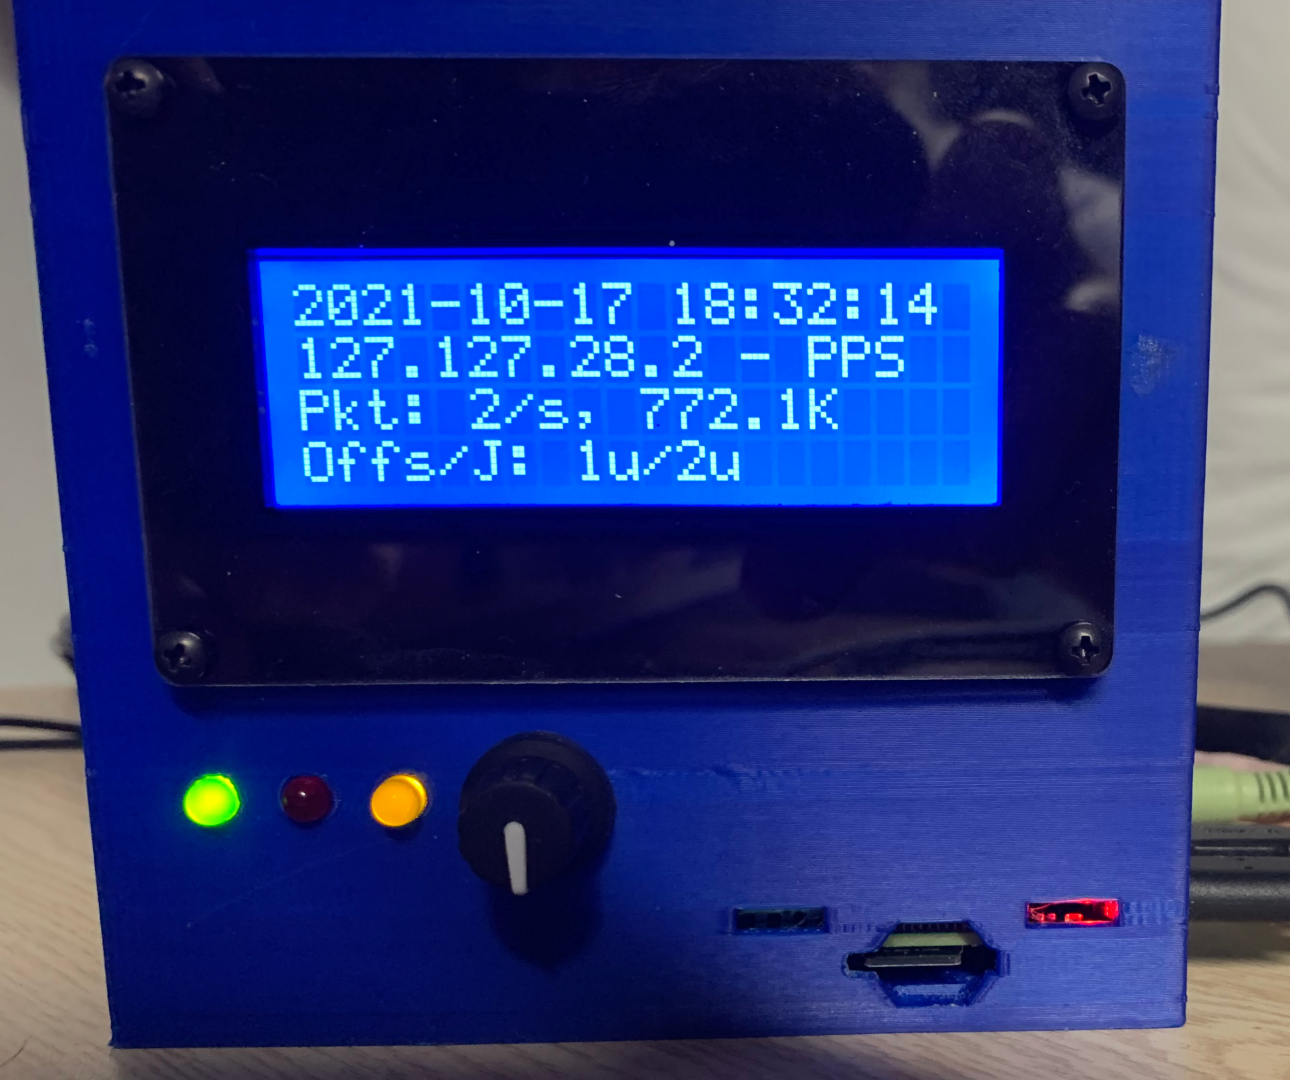
The Final Output Screen

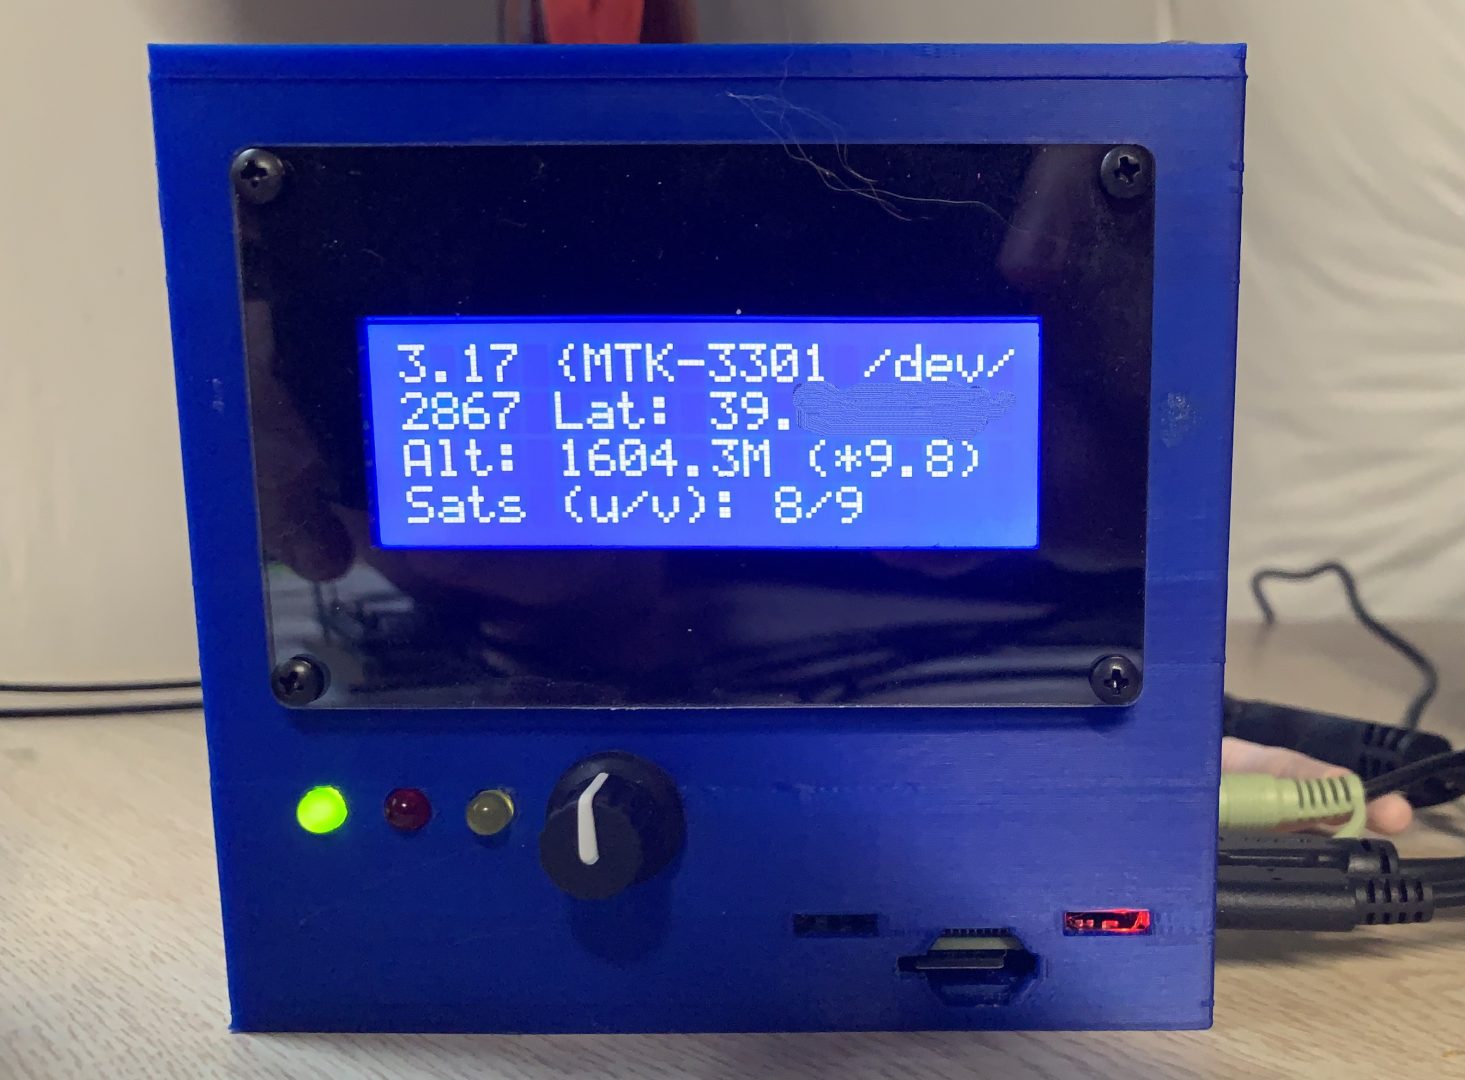
The final output screen show on the right is the completed NTP status screen. It shows the current date/time, the current peer (who NTP thinks is the best source of time data), the number of packets sent, and the offset/jitter.

In addition to the monitor screen, the daemon monitors that the peer is the expected one. Monitoring the peer ensures that if something happens with the GPS receiver, and NTP decides that it’s not a good time source, the alarm is raised.

Additionally, it monitors that the offset value is not more than a configured amount. That way if the time isn’t matching up with the PPS source from the GPS receiver, I’m notified.

Problems

During the development, I ran into a few different problems. The first was one already mentioned. On the Raspberry Pi, the output of ntpq was buffered. I browsed the source code of the ntpq command and introduced some flush() statements, but it didn’t help. In the end, I used stdbuf as a work-around.

The second problem I ran into is that if I terminated the monitoring daemon, ntpq was left running in the background AND since the file handles were invalid, it would immediately start consuming 100% of the CPU. I made a custom version of NTPQ that checks if the stdout file handle is closed, and if so, it terminates the program.

The other problem is that even with stdbuf, sometimes when you send commands, the output doesn’t come out. I’ve tested running ntpq with -n, and the hangs were resolved. The DNS resolution code in ntpq doesn’t cache addresses, and it’s single threaded, so DNS lookup can take a while. Also, I need to look at the code for ntpq and see if it it’s using the Linux resolver’s default DNS lookup retry of 3.
Using Grafana on a Raspberry Pi to Monitor NTPD and GPSD

On my Raspberry Pi NTP server project, I implemented some really simple dashboards using an LCD display. While I really like these, they’re very limited in what they can show, and they don’t display historical data. To provide historical statistics and real-time graphing, I chose to use Grafana. In this article, I’ll be sharing some URLs on configuring Grafana to monitor a Raspberry Pi, GPSD, and NTPD.

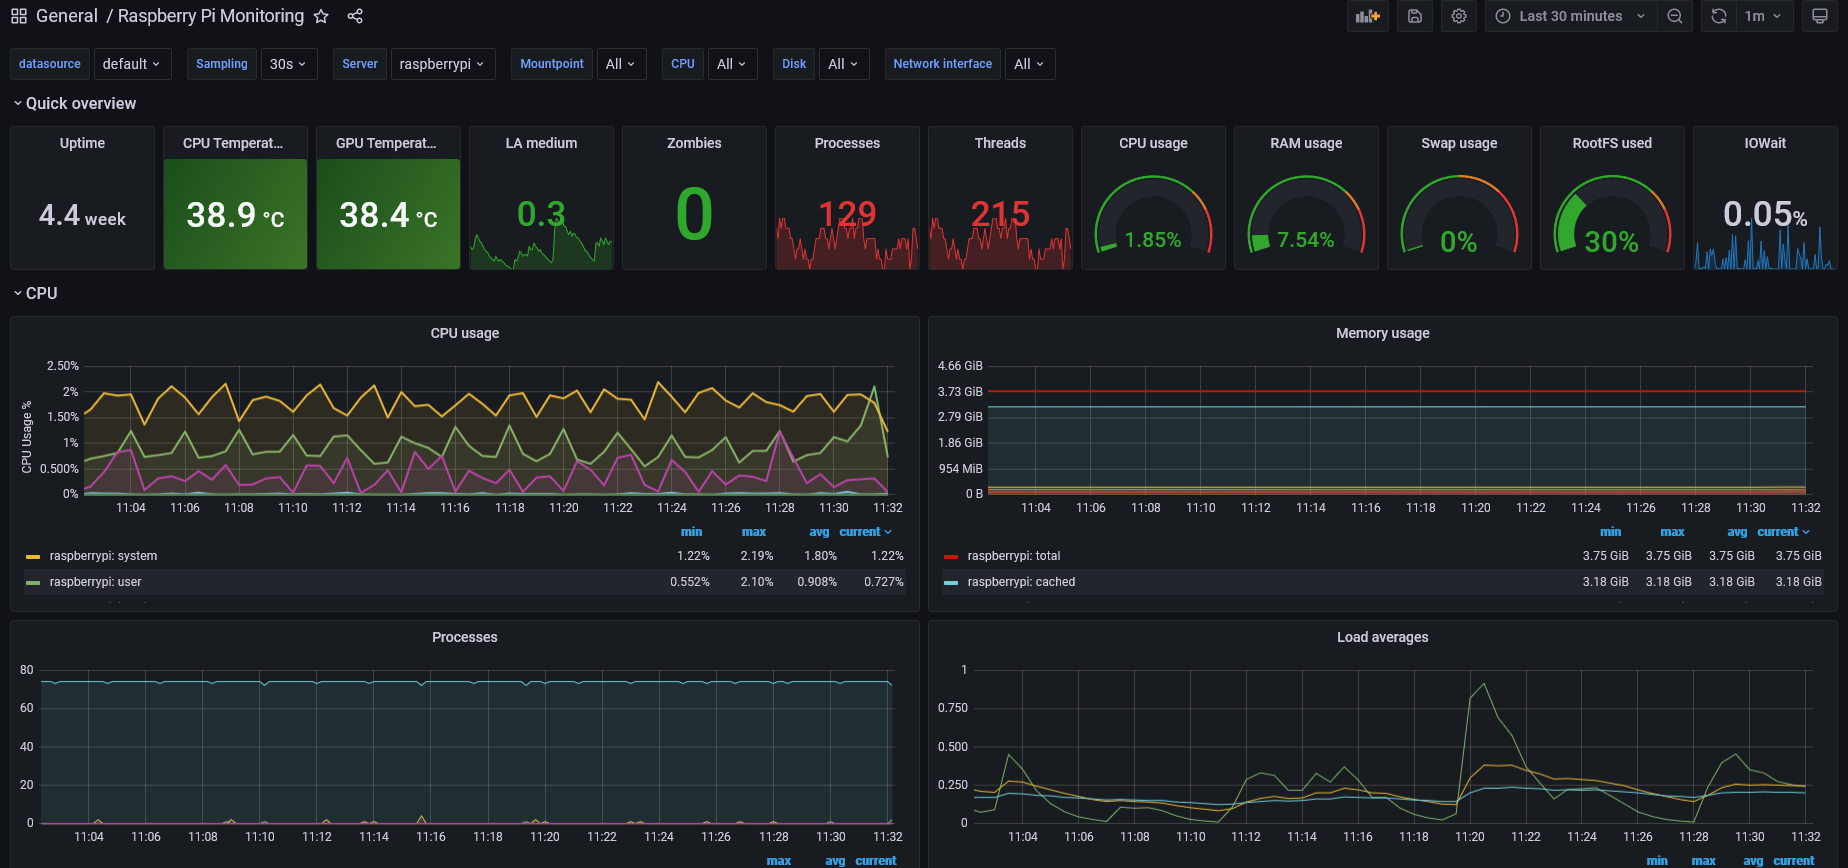
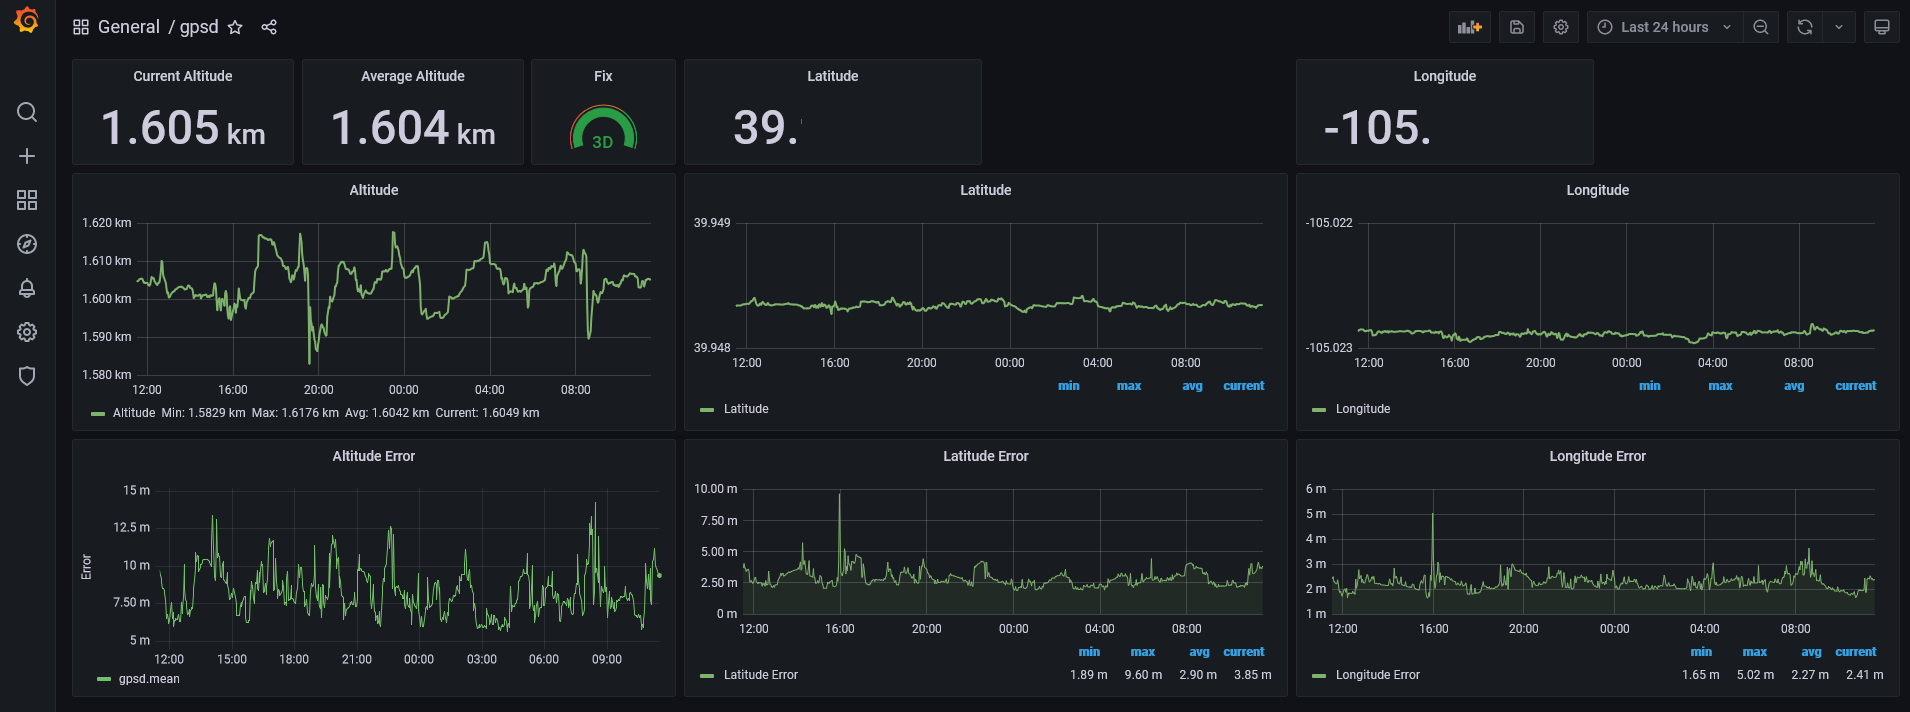
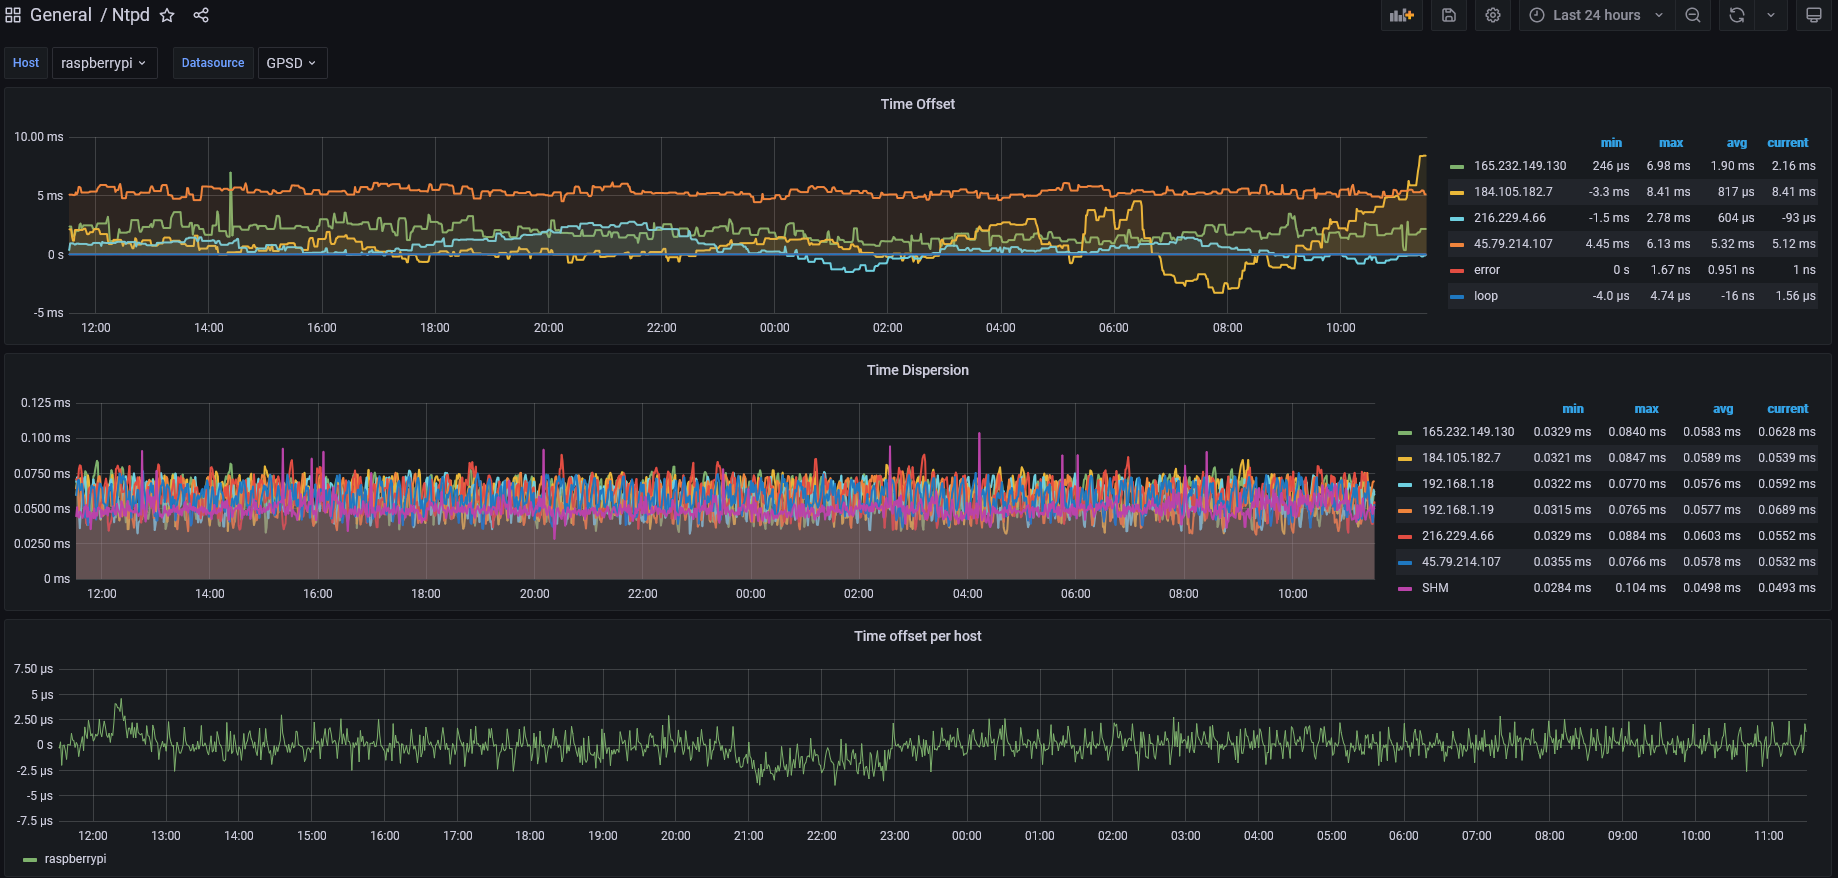
Grafana is an amazingly pretty monitoring/graphing program. It provides a ton of visualization widgets including line charts, bar charts, pie charts, text boxes, oil gauges, and many others. To use it, you configure data collectors (collected, prometheus, bash scripts, etc). These collectors insert the data into a time series database like influxdb or prometheus. Grafana dashboards then query the database(s) for data and prepares charts. Here are some examples.

Getting Started Installing Grafana

Grafana is pretty intimidating to setup and the documentation is sketchy at best. Here are my notes on what I had to do to make it work. Note that I’m not going to provide the complete steps, but pointers to the best work people have already done.

Step 1: Install Influx DB and Grafana

The best source I found was this URL. It covers installing influxdb and grafana:

https://simonhearne.com/2020/pi-influx-grafana/

The one thing I would add to this is to create retention policies on your database. This keeps the gathered data from expanding to fill all available storage. It also affects CPU utilization. With around 6 months of data, I noticed that influxdb was using substantial CPU. I used:

CREATE RETENTION POLICY "4_WEEKS" ON "gpsd" DURATION 4w REPLICATION 1 SHARD DURATION 7d DEFAULT

The influx documentation has information on how to do this.

https://docs.influxdata.com/influxdb/v1.7/guides/downsampling_and_retention/

Another good reference for the Grafana installation on a Raspberry Pi is on the Grafana web site at:

https://grafana.com/tutorials/install-grafana-on-raspberry-pi/

Step 2: Install CollectD

apt-get install collectd
systemctl enable collectd

Next, configure collectd to export to InfluxDB. Create the file /etc/collectd/collectd.conf.d/influx-export.conf with the contents shown below:

LoadPlugin network
<Plugin "network">
     Server "127.0.0.1" "25826"
</Plugin>

Step 3: Install Telegraf

Installing telegraf is easy. All you need to do is use the Pi command line:

sudo apt install -y telegraf
systemctl enable telegraf

After you install telegraf, edit /etc/telegraf/telegraf.conf and configure it to point to the influxdb database created above. Locate the [[outputs.influxdb]] section and set the database name/path.

Step 4: Install the Raspberry Pi Monitoring Dashboard

In Grafana, choose Dashboards/Manage. Click on Import and enter the ID of the dashboard. You can find the ID on it’s Dashboard page:

https://grafana.com/grafana/dashboards/10578

On that page, you’ll see a section labelled **Collector Configuration Details**. Copy the contents into /etc/telegraf/telegraf.conf

Step 5: Install the NTPD Monitoring Dashboard

Go to the Grafana Dashboard page for the plugin:

https://grafana.com/grafana/dashboards/1017

Note the ID. In Grafana, choose Dashboards/Manage. Click on Import and enter the dashboard ID.

Copy the contents of the Collector Configuration Details block into the file /etc/collectd/conf.d/ntpd.conf. If the file doesn’t exist, create it.

Step 6: Install the GPSD Monitoring Dashboard

Go to the Grafana Dashboard page for the GPSD Monitor:
https://grafana.com/grafana/dashboards/10226

Import the dashboard. You’ll need to setup a separate collector program to gather the GPSD data. You can find the source and more instructions here:
https://github.com/mzac/gpsd-influx

Step 7: Reboot

Now that everything is loaded and configured, reboot the pi to restart all affected services. Once the Pi completes reboot, browse to the Grafana installation:


http://your.pi.ip.here:3000/

Login to Grafana, and choose dashboards. Your new dashboards should be listed. Click on one of the dashboards. If the dashboard doesn’t work check the steps above.

Customizing Dashboards

Customizing Grafana dashboards is really easy. I’ll walk through setting up a customized altitude display. Since I live in the metro Denver area, we’re all a little nuts about knowing the current altitude. While the default dashboards show the altitude pretty well, I would like a custom panel that shows deviation from what I believe my true altitude to be. I don’t really know my true altitude, I’m using the average from GPSD over 7 days.

To get started, login to Grafana, and navigate to the GPSD dashboard. Select the new panel icon in the upper right area. Select an Empty Panel as the type of panel.

The first step is to establish my database query. TPV is a record type, and the value I want is alt (altitude). To transform the graph into a deviation from average style chart, I use “math” and subtract my nominal altitude, 1604.4 meters, from the mean value returned for the query.

That gives me a chart that looks like this:

The next step is to refine the chart. In the right pane, I’ll set the Title to be “Deviation from True Value”, the Axis Label to deviation. Under Standard Options, I’ll change the units of measure to Meters. I changed the Legend to hidden, since the axis label is sufficient.

The completed panel shown above now has the altitude reading’s deviation from the true value.

Another really cool feature is that Grafana provides a query inspector that allows you to modify the query, or create a query in Grafana and use that query from other tools.

Considerations for Using Grafana

The two primary concerns I have for using Grafana are the CPU consumption and the disk utilization.

Because the various collectors (collectd, telegraf, shell scripts) are continuously running, they use some CPU on the pi. On my Raspberry Pi 4 with 4GB of memory, the normal resting CPU utilization is running around 4% with everything running. That’s well within reason.

The second consideration is disk write utilization. Various web pages discuss the idea that the continuous writing to a time series database like InfluxDB might cause premature wear on the SD card. I haven’t done enough testing to satisfy myself if this is really a problem or not. If it does become a problem, the two options I would try are either configuring an iSCSI target for use by the Pi, or adding a USB disk to the system.

Finishing Up

Grafana is just an amazing piece of work. There are many predefined dashboards that can be dropped into place with very little work. The most difficult thing about it is learning all of the little details that have to be done to configure each dashboard. I hope this post will cut down on the amount of head scratching you’ll have to do.

Reading JSON GPSD Data using Network Sockets with Golang

As part of my Raspberry Pi NTP Server, I wanted the system monitoring daemon to display GPSD information on my LCD display. GPSD is a daemon that listens for GPS data from a receiver. It supports a wide variety of chips and make it easier to write generic code that supports a variety of GPS devices. In addition to text and graphical user interfaces, GPSD provides a very simple to use JSON interface that can be accessed via a network socket.

To access the data, the first thing we need to do is to create a goroutine that will connect to GPSD and receive data. One of the things about golang IO is there’s just not a way to do non-blocking IO. To get around that, I use a goroutine to handle reading from GPSD.

Here’s the startup code. It establishes the TCP connection, and puts it into WATCH mode. Then, it creates a text scanner that reads from the socket. As lines are received, they’re sent to the data channel for processing.

// Goroutine to background update the GPS data.
func GPSDMonitor() {
  var conn net.Conn
  ch := make(chan string, 32)
  initComplete := make(chan int)
  var scanner *bufio.Scanner
  go func() {
    for {
      if conn == nil {
        fmt.Printf("Establishing TCP Connection to %s:%d\n", gpsdSource, gpsdPort)
        tcpAddr, err := net.ResolveTCPAddr("tcp4", fmt.Sprintf("%s:%d", gpsdSource, gpsdPort))
        if err != nil {
          log.Fatal(err)
        }
        conn, err = net.DialTCP("tcp", nil, tcpAddr)
        if err != nil {
          log.Fatal(err)
        }
        conn.Write([]byte("?WATCH={\"enable\": true}\n?POLL;\n"))
        rdr := bufio.NewReader(conn)
        scanner = bufio.NewScanner(rdr)
        scanner.Split(bufio.ScanLines)

      }
      initComplete <- 1
      for scanner.Scan() {
        line := scanner.Text()
        ch <- line
      }
      log.Print("Broke from scanner.scan()")
    }
  }()
  <- initComplete
  ...
}

One of the things really worth mentioning in the code above is the initComplete channel. I don’t want to enter the code that reads the data until the connection is established and things are initialized. My first effort looked something like:

var conn net.Conn
go func(){
  if conn==nil {
    connTmp = (create the connection)...
    scanner = (create scanner)
    conn = connTmp
    for scanner.Scan() {
        ch <- scanner.Text()
    }
  }
}()
for conn == nil {
  time.Sleep(100 * time.Millisecond)
}
...

I wasn’t really happy with this. I know from experience that compilers can re-order operations very unexpectedly and variables can be assigned in an order you don’t expect. Clearly, some synchronization would be better. My second effort was:

var initLock sync.Mutex
var conn net.Conn
go func() {
  for {
    if conn==nil {
      initLock.Lock()
      conn = (create the actual connection)
      scanner = (create scanner)
      initLock.Unlock()
    }
  }  
}()
// Block here until the initialization is complete.
initLock.Lock()
initLock.Unlock()
// Begin rest of block.

The naive assumption of this effort was that initLock.Lock() would be called in the goroutine first. What actually happened was the goroutine didn’t start running until after the main branch had blown through the synchronization block. To my credit, it didn’t take me a long time to realize what I had done. My final effort at synchronizing the initialization used a channel, and it looked like this:

var conn net.Conn
initComplete := make(chan int)
go func() {
  for {
    if conn==nil {
      conn = (create the actual connection)
      scanner = (create scanner)
      initComplete <- 1
    }
  }  
}()
// Block here until the initialization is complete.
<- initComplete
// Begin rest of block.

With this locking, I’m guaranteed that the connection is initialized before the processing code begins executing. The read from the initComplete channel ( <- initComplete) will block until there’s data present. Data isn’t present until the initialization is complete.

The next piece is the processor that reads the lines and calls the parsers. When a line of data is received, the select statement unblocks. If no lines are received then after the poll interval has elapsed, the time.After(pollInterval) statement unblocks and a poll command is sent.

  for {
    // This is the poll/process loop that accepts the
    // received lines and processes them.
    <-initComplete
    readLines := false
    for conn != nil {
      select {
      case line := <-ch:
        processLine(line)
        readLines = true
      case <-time.After(pollInterval):
        if readLines {
          conn.Write([]byte("?POLL;\n"))
          readLines = false
        } else {
          log.Print("Didn't get any data on GPSD poll. Closing connection.")
          conn.Close()
          conn = nil
        }
      }
    }
  }

The next part is to actually process the received lines. There is a golang library for GPSD which defines structures for the GPSD data records and handles unmarshalling the JSON response data into variables. Since I wanted to understand using JSON I didn’t go this route. Instead, I wrote my own unmarshalling code. Here’s an example of how I unmarshall the TPV record from GPSD.

func processLine(line string) {
  if len(line) < 16 {
    return
  }
  var f interface{}
  err := json.Unmarshal([]byte(line), &f)
  if err != nil {
    log.Print(err)
    return
  }

  m := f.(map[string]interface{})
  cl := m["class"]
  switch cl {
  case "VERSION":
    version = fmt.Sprintf("GPSD v%s", m["release"].(string))
  case "DEVICES":
    processDevices(m["devices"].([]interface{}))
  case "POLL":
    processPoll(m)
  case "WATCH":
  default:
  }
}

func processPoll(m map[string]interface{}) {
  for k, v := range m {
    switch k {
    case "sky":
      processSky(v.([]interface{})[0].(map[string]interface{}))
    case "tpv":
      processTPV(v.([]interface{})[0].(map[string]interface{}))
    }
  }
}

An example TPV data record looks like this:

     map[alt:1600
         class:TPV
         climb:0
         device:/dev/ttyS5
         eps:9.37
         ept:0.005
         epv:13.703
         epx:6.019
         epy:6.019
         lat:39.923813333
         lon:-105.4332213
         mode:3
         speed:0
         status:2
         time:2021-07-18T16:30:55.000Z
         4track:201]

To unmarshall the TPV data, is pretty ugly. Here’s a picture of how it’s done. It de-references the lat value, obtaining a float value by performing a type assertion to float64. If lat were not a float64 value, that type assertion would generate an error.

To handle keys that might not be present, you use the second form of reading a map value. In the example below, altHAE. If it’s not present, then an attempt is made to read altMSL.

  latitude = m["lat"].(float64)
  longitude = m["lon"].(float64)
  if v, ok := m["altHAE"]; ok {
    altitude = v.(float64)
  } else if v, ok := m["altMSL"]; ok {
    altitude = v.(float64)
  } else {
    if v, ok := m["alt"]; ok {
      altitude = v.(float64)
    } else {
      altitude = 9999.0
    }
  }

Conclusion

Processing the socket IO is pretty tricky. Some of this is how I chose to use GPSD. There is a mode where GPSD will continuously stream JSON records as it’s state is updated. I decided that I didn’t need the data that frequently, and didn’t want to pay the CPU overhead of parsing data continuously.

Using goroutines allowed me to have a connection/receiver, and a separate, simpler line processor. If I were writing this in another language, I would probably write the routine to read from the network socket with a specified timeout value.

Now that I understand how to manually unmarshall the JSON, in other areas, I’ll use the built-in golang methods for handling it.

Interfacing the Adafruit I2C/SPI LCD Backpack with a Raspberry Pi using Golang

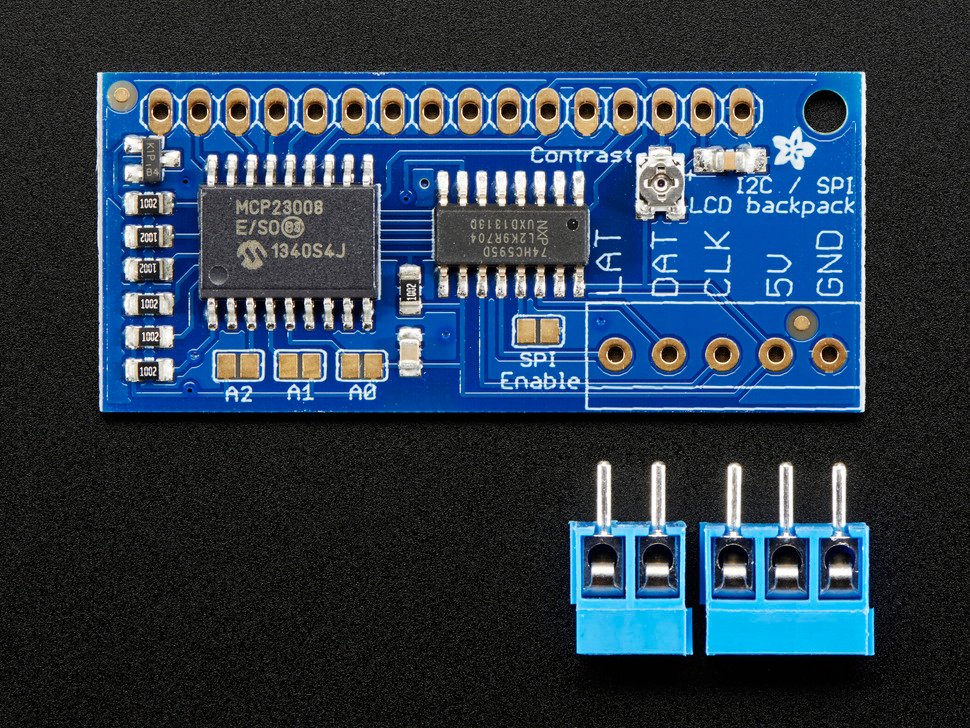
One of the features I wanted for my Raspberry Pi NTP Server system was an LCD screen that provides information on the state of the system. Things I wanted to display were a real-time clock, GPS information, NTP information, etc. To do that, I decided to use the Adafruit I2C/SPI Backpack. The backpack mounts on an LCD display and provides the I2c/SPI interfaces.

Unlike other backpacks, including those from Adafruit, this is really just an IO expander. It doesn’t provide a layer to manage the lower level Hitachi HD44780U LCD Display. For example, the Adafruit USB/Serial backpack manages the initialization of the display, and the low level details of sending commands like clear screen. With that kind of device, you can actually just send output to the serial port the backpack creates and the text is displayed.

Since the backpack doesn’t handle initializing the LCD, or managing the IO to it, you have to create a device driver to do this. This is somewhat hard. When I wrote the Java version I spent hours trying to figure it out only to realize that I hadn’t adjusted the contrast.

The backpack uses a Microchip MCP23008 IO expander to provide the I2c/SPI interfaces. This expander provides 8 IO lines that can be written and read via I2C or SPI. Four of the IO pins are connected to the D4-D7 lines on the HD44780U, and 3 of the lines are used for the RESET pin, ENABLE pin, and R/W pin, leaving one pin unconnected.

The best resource for understanding things the underlying LCD is the Hitachi HD44780U datasheet. It describes the initialization sequence for 4bit/8bit mode, and documents the commands to do things like clear the screen, position the cursor, etc.

A good resource for understanding how to talk to the device I2C/SPI backpack is the Adafruit Arduino driver source code.

To interface with the device, I chose to use the periph.io golang/conn package. Using this package, it was possible to create code that would write to the MCP23008. The MCP23008 is a nifty little chip that provides 8 IO ports and makes them accessible via I2C/SPI. In addition to providing the IO ports, it provides interrupt capabilities for handling pin stage changes. To learn about it’s capabilities, refer to the datasheet.

In my Drawer of WondersTM, I actually have 4 different LCD displays so I was interested in creating code that would allow me to interchangeably use them for this project. For example, I have a Matrix Orbital USB LCD device, a Sparkfun SerLCD device, and a display powered by the Adafruit USB backpack. To make them interchangeable, I created a Go LCD interface.

type LCD interface {
    // Enable/Disble auto scroll
    AutoScroll(enabled bool)
    // Return the number of columns the LCD Supports
    Cols() int
    // Clear the display and move the cursor home.
    Clear()
    // Set the cursor mode. You can pass multiple arguments.
    // Cursor(CursorOff, CursorUnderline)
    Cursor(mode ...CursorMode)
    // Move the cursor home (1,1)
    Home()
    // Return the min column position.
    MinCol() int
    // Return the min row position.
    MinRow() int
    // Move the cursor forward or backward.
    Move(dir CursorDirection)
    // Move the cursor to arbitrary position (1,1 base).
    MoveTo(row, col int)
    // Return the number of rows the LCD supports.
    Rows() int
    // Turn the display on / off
    SetDisplay(on bool)
    // Write a set of bytes to the display.
    Write(p []byte) (n int, err error)
    // Write a string output to the display.
    WriteString(text string) (n int, err error)
}

The interface defines the command that all of my LCD devices are capable of. Now, I can create generic code that uses any implementation of the LCD interface.

To handle the details of interfacing with the Hitachi HD44780 chip, I created a HD44780 interface:

type HD44780 struct {
    w    io.Writer
    mu   sync.Mutex    
    rows int
    cols int
    on   bool
    cursor bool
    blink bool
}

// Function definitions to implement the LCD interface.
func (lcd *HD44780) Clear() {
    lcd.w.Write(getCommand(clearScreen))
    time.Sleep(2 * time.Millisecond)
}

Finally, to represent the backpack, I created a Backpack package. Note that because the LCD member begins with an initial capital, it’s exported and available to code using the backpack.

type AdafruitI2CSPIBackpack struct {
    LCD *HD44780
    mcp *mcp23008.MCP23008
    on  bool
}
// Now the commands to talk to the display using the MCP23008

func (bp *AdafruitI2CSPIBackpack) SendCommand(commands []LCDCommand) error {
    var err error
    _, err = bp.mcp.WriteGPIOPin(rsPin, bool(modeCommand))
    if err != nil {
        log.Print(err)
    }
    for _, command := range commands {
        bp.write4Bits(byte(command >> 4))
        bp.write4Bits(byte(command))
    }
    return err
}
func (bp *AdafruitI2CSPIBackpack) write4Bits(value byte) error {
    writeVal, err := bp.mcp.ReadGPIO()
    value = value & 0x0f
    writeVal &= 0x83
    writeVal|=(value << 3)
	
    if err != nil {
        return err
    }

    _, err = bp.mcp.WriteGPIO(writeVal)

    writeVal|=0x04
    _, err = bp.mcp.WriteGPIO(writeVal)

    writeVal &= 0xfb
    _, err = bp.mcp.WriteGPIO(writeVal)

    return err
}

func NewAdafruitI2CSPIBackpack(conn conn.Conn, rows, cols int)
             *AdafruitI2CSPIBackpack {
    mcp, err := mcp23008.NewMCP23008(conn)
    if err != nil {
        log.Fatal(err)
    }
    bp := AdafruitI2CSPIBackpack{mcp: mcp}
    bp.LCD = NewHD44780(&bp, rows, cols)
    bp.init()
    return &bp
}

Now I can create a display and write text to it:

func main() {
    bp := adafruit.NewAdafruitI2CSPIBackpack(conn, 4, 20)
    bp.SetBacklight(1)
    bp.LCD.Clear()
    bw.WriteString("Hello!")
}

Scrolling Text

One of the downsides to the 20×4 LCD display is sometimes you just have more text than will fit on a line. To handle that, I created a function that implements horizontal scrolling. The interface for the scroller is:

type LCDScroller struct {
    lcd     lcdlib.LCD
    lines   []scrollInfo
    mu      sync.Mutex
    newData chan struct{}
    stop    chan struct{}
}

// Create a scroller
// Create a new LCD Scroller attached to the specified
// lcd display.
func NewLCDScroller(lcd lcdlib.LCD) *LCDScroller {
    scroller := LCDScroller{lcd: lcd,
                    newData: make(chan struct{}, 1),
                    stop:    make(chan struct{}, 1),
                    lines:   make([]scrollInfo, lcd.Rows())}

    for i := 0; i < lcd.Rows(); i++ {
        scroller.lines[i] = scrollInfo{}
    }
    return &scroller
}

// Set the content lines to be displayed on the LCD. Number of lines
// should not exceed the number of LCD display lines. If the number
// is exceeded, the extra lines are dropped.
func (scroller *LCDScroller) SetLines(lines []string) {
  // the code to scroll goes here
}

func main() {
    // create scroller
    scroller:=utils.NewLCDScroller(bp.LCD)
    scroller.SetLines([]string{"hello!"})
}

Another nice capability built into the scroller is that if a line is updated, it finds the offset within each line of the first change, and the length of the changed text. Since each character written requires 10 I2C transactions, optimizing this is helpful. So, if a line displaying a real time clock is updated, and only the seconds value is update, only one byte is written to the display.

Conclusion

Finished LCD Display

The finished project works really well. In the photo, the rotary switch can be used to change between different displays.

Because I used Golang’s interface feature, I can create different packages that implement the LCD interface allowing me to easily change the hardware without big changes to the code.

To download the complete source code, visit my github.com page.

NTP Server Monitoring Daemon Alarming System Design and Implementation

One of the things I really wanted for my Raspberry Pi 4 NTP Server project was a visual indicator if something is wrong. I hate having things not work and not realizing it until it’s a problem.

An example would be if the GPS interface were malfunctioning and the NTP peer changed away from the GPS PPS signal. Another example would be if CPU utilization became too high.

To do that, I created an alarming package for the Golang daemon. The first component is an alarm record. It defines a memory structure that services that want to raise an alarm can use.

type Alarm struct {
    Key         string
    Description string
    Raised      bool
}

The next element was to give system monitors a way of raising the alarm. The SendAlarm() function accepts the alarm record, checks a couple of conditions, and then transmits the alarm to the alarm channel. It makes sure the alarm channel isn’t full, and if it is, drops the alarm. This keeps the sending goroutine from possibly blocking because the alarm processor isn’t running or is busy.

func SendAlarm(alarm Alarm) {
    if alarmChannel == nil {
        log.Print("Alarm Channel not initialized. Dropping alarm.", alarm)
    } else if len(alarmChannel) == alarmChannelSize {
        log.Print("Alarm channel full. Possible error in process alarms.")
    } else {
        alarmChannel <- alarm
    }
}

Here’s a example of how the GPSD Monitoring system raises an alarm if the number of satellites is too low:

alarm := alarms.Alarm{Key: "UsedSatellites", Raised: (usedSats < minSatellites)}
if alarm.Raised {
    /*
        The number of used satellites for our fix/position is less
        than the desired number. For a standard GPS, non-fixed
        position/non-timing mode, 4 satellites are required for a
        3D fix.
    */
    alarm.Description = fmt.Sprintf("Used Sats = %d < %d", usedSats, minSatellites)
    alarms.SendAlarm(alarm)
    raisedAlarms[alarm.Key] = struct{}{}
} else {
    if _, present := raisedAlarms[alarm.Key]; present {
        // The alarm was previously raised. Clear it.
        alarms.ClearAlarm(alarm)
        delete(raisedAlarms, alarm.Key)
    }
}

I wanted to make different kinds of listeners that would respond to alarm events. For example, I wanted a listener that would print the alarms to the system log. Another example might be a listener that would send an SMS message when an alarm is raised. Here’s the log listener:

type AlarmListener func(Alarm)

func AddListener(lstnr AlarmListener) {
    listeners = append(listeners, lstnr)
}

func LogListener(alarm Alarm) {
    if alarm.Raised {
        log.Printf("Alarm Raised: Key: %s, Description: %s", 
                    alarm.Key, alarm.Description)
    } else {
        log.Printf("Alarm Cleared: Key: %s", alarm.Key)
    }
}

func main() {
    alarms.AddListener(alarms.LogListener)
}

To handle the LED flasher, I created an indicator. The indicator just receives notification of the state. Is an alarm raised or not?

type AlarmIndicator interface {
    SetState(state bool)
    Close()
}

var indicators []AlarmIndicator

func AddIndicator(indicator AlarmIndicator) {
    indicators = append(indicators, indicator)
}

func main() {
    // Now, we can add the LED indicator
    alarms.AddIndicator(ledIndicator)
}

The alarm processing code invokes the indicators:

for _, indicator := range indicators {
    // For indicators, we set the state
    //
    // True = Any Alarm is Raised
    // False = No Alarms are Raised.
    indicator.SetState(len(mRaised) > 0)
}

The LED indicator code is show below. If it’s set to True, the indicator starts a goroutine that turns the LED on and off every 500ms. If the state is false, a message is sent to the termination channel ch. The send on the ch channel will unblock the flasher goroutine and cause it to terminate.

func (led *LEDIndicator) SetState(state bool) {
    if state {
        if led.running {
            return
        }
        led.running = true
        go func() {
            on := 0
            for led.running {
                select {
                case <-time.After(BLINK_INTERVAL):
                    // toggle LED
                    if on%2 == 0 {
                        led.pin.Out(led.enabled)
                    } else {
                        led.pin.Out(led.disabled)
                    }
                    on = on + 1

                case <-led.ch:
                    led.running = false
                    led.pin.Out(led.disabled)
                }
            }
        }()
    } else {
        if led.running {
            led.ch <- 0
        }
        led.pin.Out(led.disabled)
    }
}

The final piece that makes it all work is the alarm processor routine. It’s run as a goroutine so that it’s always active. When an alarm is sent, the read from alarmChannel unblocks.

func ProcessAlarms() {
    fmt.Println("ProcessAlarms() entered!")
    alarmChannel = make(chan Alarm, alarmChannelSize)
    defer close(alarmChannel)
    mRaised = make(map[string]Alarm)
    for {
        alarm := <-alarmChannel
        _, present := mRaised[alarm.Key]
        propagate := false
        if present {
            if alarm.Raised {
                // This is a re-raise. Don't propagate it, but in case the
                // message has changed, update it.
                mRaised[alarm.Key] = alarm
            } else {
                propagate = true
                delete(mRaised, alarm.Key)
            }
        } else {
            if alarm.Raised {
                propagate = true
                mRaised[alarm.Key] = alarm
            }
        }
        if propagate {
            // For listeners, we only send when there's a new alarm,
            // or an existing one is cleared.
            for _, lstnr := range listeners {
                lstnr(alarm)
            }
            for _, indicator := range indicators {
                // For indicators, we set the state
                //
                // True = Any Alarm is Raised
                // False = No Alarms are Raised.
                indicator.SetState(len(mRaised) > 0)
            }
        }
    }
}

Conclusion

The Go Language made creating a generic alarm subsystem a really easy task. The entire alarm handling package is 106 lines of Golang. More importantly, it’s easy to understand, and easy for clients to use. It supports multiple listeners, and different indicators.

Looking at the whole package, one key feature that might be useful would be an implementation that would handle hysteresis or flapping. Most of the elements are present, and it would be pretty straight forward to do.

Using Golang for Creating Linux System Monitoring Daemons

When I first created my current Raspberry Pi 4 NTP server, I created a monitoring daemon in Java using Pi4j. I’ve got decades of experience in Java programming, so it was pretty straight-forward. The biggest problem for the Java application was writing the device driver for the Adafruit I2C/SPI backpack.

I wanted to learn Golang and this seemed like a great project. It was re-implementing something I’d already done, and it was also non-trivial, requiring some real-world skills including:

  • Network Socket Communication
  • Processing JSON messages
  • Hardware device interfaces
  • Executing external programs and reading output.
  • Multi-processing/multi-threading.
  • Processing configuration files.

What I found is that golang is really well suited for writing daemons. This isn’t surprising when you consider some of the software that is powered by golang. Things like docker, helm, kubernetes, etc. It also threads the needle between interpreted code, and compiled code with the use of a garbage collector.

Go Routines

The first really cool thing about Go is how simple it is to write a background process. In Java, you would create a class that implements Runnable, and create a new thread with it. In golang, you declare a function and execute using the go statement.

func monitor_something() {
    for {
        // Perform the monitoring process here
        time.Sleep(time.Second)
    }
}

func main() {
  go monitor_something()
  go monitor_something_else()
  for {
    time.Sleep(10 * time.Second)
  }
}

You can also create go routines as closures:

func main() {
  i:=0
  go func() {
     for {
         // Some background process code here.
         i = i + 1
         time.Sleep(time.Second)
     }
  }()

  for {
     // do other things.
     log.Print("The value of i is: ", i)
     time.Sleep(time.Second)
  }
}

the anonymous go routine runs as a background process but has scoped access to the variables in the enclosing function.

Channels

The next really cool feature of golang that made this project easier was channels. In golang, a channel is a communications pipe that you can send and receive data on. In Java and other languages, communications between threads is done using memory variables, and access is controlled via semaphores/mutexes. In golang, channels are the preferred mechanism. Here’s a really simple example:

// Create the channel
ch := make(chan int, 16)
// Write the value 32 to it.
ch<- 32
// Read the next value from the channel and assign the value to chValue
chValue:=<-ch

Channels can also handle more complex data types:

type Alarm struct {
	Key         string
	Description string
	Raised      bool
}
alarmChannel = make(chan Alarm, alarmChannelSize)

Here’s an example of a rotary switch implementation using channels. It shows how the switch class generates messages on a channel that consumers can read from.

type RotarySwitchValue int

func (sw *RotarySwitch) Position() int {
	return sw.position
}
// Construct a new Rotary Switch by passing in the gpio.PinIO.
// 
// maxPosition can be used to  keep track of the relative position of the switch.
//
// To receive events, read the Channel returned by RotarySwitch.Channel(). The
// value returned will be one of the constants.
//
// If you're using a Rotary Switch that doesn't include a button switch, pass
// gpio.INVALID for buttonPin.
func NewRotarySwitch(statePin, dataPin, buttonPin gpio.PinIO, maxPositions int)
			 *RotarySwitch {
	statePin.In(gpio.PullUp, gpio.BothEdges)
	dataPin.In(gpio.PullUp, gpio.NoEdge) 
	
	channelSize := 16
	sw := RotarySwitch{ch: make(chan RotarySwitchValue, channelSize),
		st_pin:        statePin,
		data_pin:      dataPin,
		button_pin:    buttonPin,
		max_positions: maxPositions,
		channelSize:   channelSize,
		last_state:    gpio.High,
		last_button:   gpio.Low}
	// Start the go routine that will put events on the channel.
	go rotaryHandler(&sw)
    if buttonPin!=gpio.INVALID {
        buttonPin.In(gpio.PullUp, gpio.BothEdges)
	// Start the go routine that will put button presses on the channel.
        go buttonHandler(&sw)
    }
	log.Print("Rotary switch provisioned.")
	return &sw
}

func main() {
	sw := switches.NewRotarySwitch(
        	gpioreg.ByName("GPIO21"),
	        gpioreg.ByName("GPIO20"),
		gpioreg.ByName("GPIO19"),
		6)

	defer sw.Close()
	for {
		f := functions[functionIndex]
		mr := f()
                scroller.SetLines(mr.Data)
		select {
		case swAction := <-sw.Channel():
		switch swAction {
                case switches.ButtonPress:
                	// TODO: Turn the display off on a button press.
			log.Println("Button Pressed")
		case switches.ButtonRelease:
			log.Println("Button released")
	         default:
        	        functionIndex = sw.Position()
		}
		case <-time.After(10 * time.Second):
	}
}

In this case, the select switch will block until a rotary switch event happens, putting data on the channel, or until a timeout occurs. The really clever thing about this is that when a rotary switch event happens, the select statement unblocks immediately. I don’t have to do anything tricky to make the sleep routine exit prematurely. If I were doing this in Java, I would have a listener function that would receive the event notification and it would change the variable. I would then use a short timeout and update if the value changed.

In a future post, I’ll discuss the alarming system of the monitoring daemon and how it uses channels.

Resources

The two best resources for learning Golang on this project were:

The Go Programming Language by Alan Donovan and Brian Kernighan

The Go Programming Language is the authoritative resource for any programmer who wants to learn Go. It shows how to write clear and idiomatic Go to solve real-world problems. The book does not assume prior knowledge of Go nor experience with any specific language, so you’ll find it accessible whether you’re most comfortable with JavaScript, Ruby, Python, Java, or C++.

Concurrency in Go by Ketherine Cox-Buday

Concurrency can be notoriously difficult to get right, but fortunately, the Go open source programming language makes working with concurrency tractable and even easy. If you’re a developer familiar with Go, this practical book demonstrates best practices and patterns to help you incorporate concurrency into your systems.

Creating the Case for the Pi NTP Server

I’ve spent hours and hours looking at different case models for my Raspberry Pi NTP server without luck. My basic requirement is that the case be large enough to add elements like the LCD display, and have space for the Pi and perhaps some ancillary circuit boards. There’s just nothing out there that meets these needs.

I eventually came around to the idea of 3D printing my own case. I admit, I spent a lot of effort avoiding this idea. I was concerned that it would take too long to learn how to use the CAD software, and that I’d have to purchase a 3D Printer.

When a friend offered to 3D print the case, 1 of my 2 objections was removed. I looked around and decided that Tinkercad would be a good solution for creating my case.

3D drafting takes some effort in changing your thought process. For example, to create the box shape, I drew a cube primitive. I then created another cube primitive, and subtracted it from the first. Here’s a step-by-step guide of the basic process.

Step 1: Draw the box

Step 2 – Clone the box, and make it 2mm smaller in all three dimensions.

Step 3 – Center the smaller cube inside the larger one, and then align the top edges

Step 4 – Mark the smaller shape as a “Hole” and intersect the smaller cube with the larger.

To make the cutouts for the Pi’s connectors, mounting hardware, etc. I created a simple 3D Raspberry Pi 4. I can re-use this on multiple projects. I just have to import it into a new project, subtract it from my case, and I have all of the connector holes done in one simple step.

In the same way, I made a 60mm Fan Cutout

The fan cutout when intersected with the lid creates this:

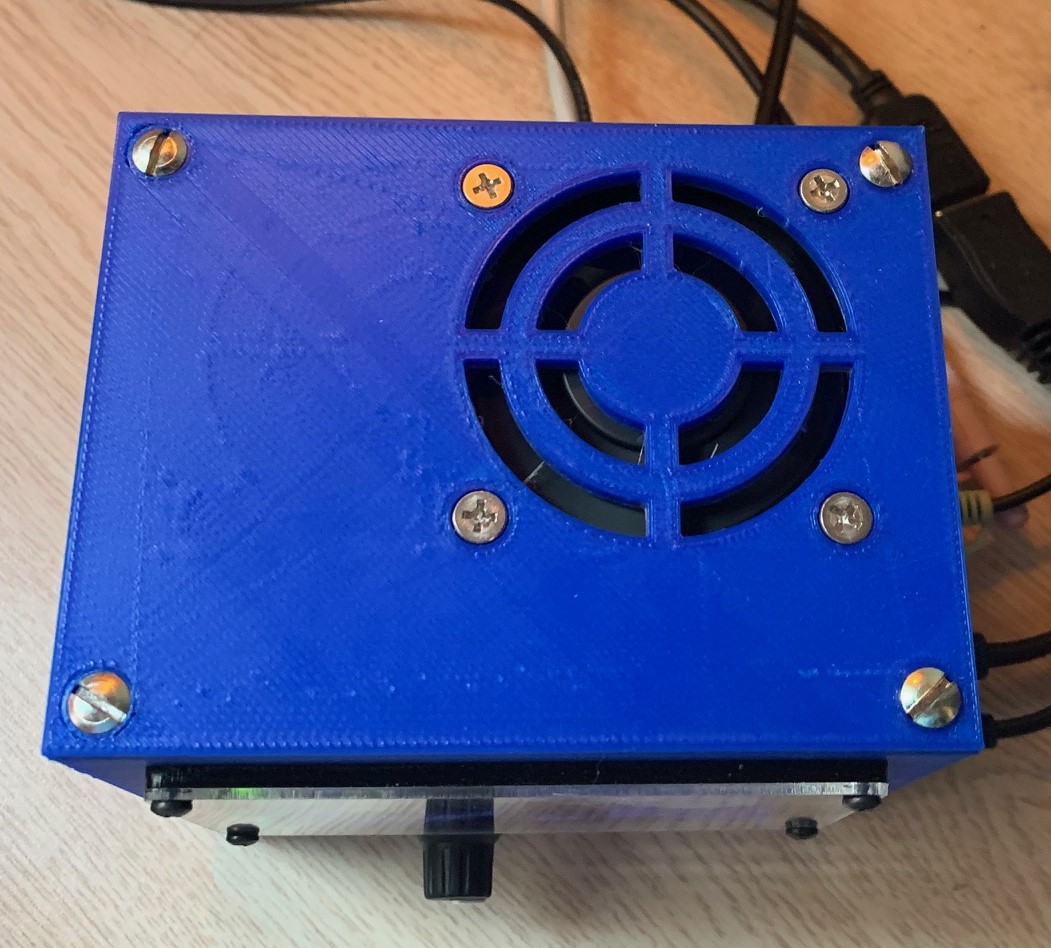
As I mentioned in the beginning, a friend 3D printed the final product for me. There are also 3D printing companies available online that can print your project for you. I tried a local one initially, and was pleased with the result. The final printed case looks like this:

Things to Change

I’ll look at 3D printing cases for future projects. The time I spent shopping for cases outweighed the time spent learning the CAD software and creating design. Since I’ve created re-usable components future efforts will be a lot faster too.

In the front of the case, there’s an opening to allow removal of the SD card. If I build a case like this in the future, I think I would like to use a SD extender cable so the card could be accessed from the top of the case, and that opening wouldn’t be necessary.

Creating a Raspberry Pi NTP Server Monitoring Daemon

I’ve been building Raspberry Pi NTP servers ever since the first Raspberry Pi became available. Each time I complete one, I think that the next one I build will be the final one. I think I’ve built at least 5 previous models. I’ve built really basic ones, and some with built in clock displays. I’ve used a variety of chipsets for GPS, including Garmin GPS-16X puck receivers, the Adafruit GPS Hat, various Sparkfun chips, etc.

My latest effort is to improve the management/ease of use. In this series of blog posts, I’ll go over some of the neater things that were in this one. The picture shows the completed project.

This NTP server adds some pretty neat features.

  • Monitoring service that watches parameters like NTP offset, CPU Utilization, etc. Additionally, the monitoring service provides the informational screens to drive the LCD display.
  • Alarm LED, If a limit is exceeded, a red LED is flashed, indicating alarm state.
  • A PPS indicator on the front of the case. This provides a continuous indication that the GPS signal is locked.
  • An LCD Display to show status screens. In total, there are 5 screens:
    • Clock/NTP Info, real-time clock, NTP peer name, NTP Packets, offset and Jitter
    • GPSD Info including latitude/longitude, altitude, and used/visible satellites.
    • System load information including CPU, Load, RAM, and uptime.
    • Network interface information including IP Address, and transfer statistics.
    • Raised Alarms Screen
    • Raspberry Pi information including chipset/revision information.
  • A rotary switch for selecting the active information screen.
  • Use of Grafana for monitoring NTP, the Raspberry Pi, and GPSD.

In future posts, I’ll give more details about the creation of the system. I’ll cover:

Using connectDaily 5.0’s New Pooled Resource Feature

One of the really cool new features connectDaily 5.0 introduced is Pooled Resources. Pooled Resources are resources where you have more than one of particular item, and you don’t need to track the specific items by name. Common examples would be Tables, Chairs, Laptops, Projectors, Projector Screens, A/V Carts, etc.

Using the new Pooled Resource feature, you could add “Large Round Table” as a resource and set the quantity on hand to be 12. When you create an event that needs tables, you would select “Large Round Table” and then enter the number you need. If you have two events next Thursday evening that each use 5 tables, and you try to create another event for Thursday evening that uses more than 2 tables then a resource conflict is displayed.

Scheduling Pooled Resources

Creating Your First Pooled Resource

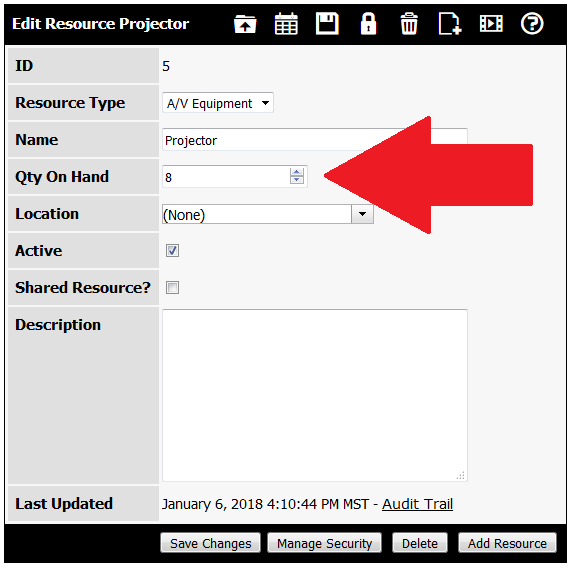
The first step is to create your new pooled resource and specify a quantity. From the menu, choose Edit | Resources. On the List Resources Screen, click on the Add Resource button. You’ll be taken to the Edit Resource Screen. Enter your resource name, quantity on hand, and a description if desired.

Create Your Calendar Event Using the Resource

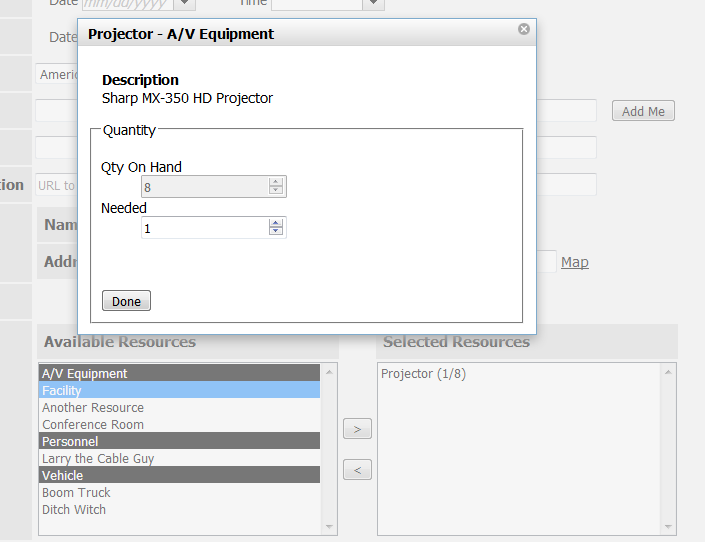
Next, create your event and add a pooled resource. When you add a pooled resource to an event, a dialog box will appear displaying the resource’s description, the quantity on hand, and you can specify how many you need. If you want to change the quantity after you’ve already added it, right-click on the resource and choose “Change Quantity” from the context menu.

Example Selecting Pooled Resource

When Resource Conflicts Happen

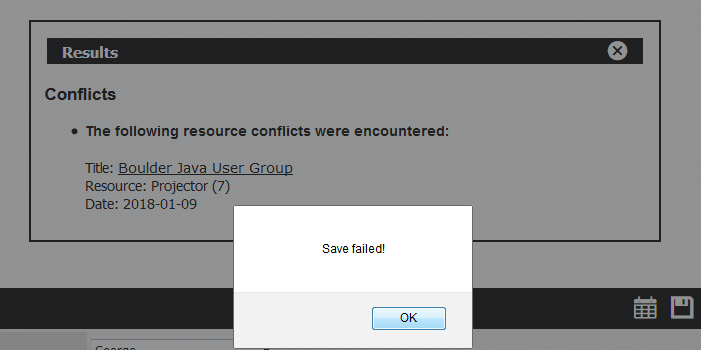
If you try to use more of a pooled resource than are available, a resource conflict is displayed:

Resource Conflict Message

Scheduling Conflicts

One of the common questions we hear is: “Will it only show the quantity available?” In other words, will connectDaily take into account how many tables have been used and only show the number remaining? The answer is no.

The first reason is that until all of the event information is entered including start and end date, times, and recurrence patterns, we don’t know WHEN to check for conflicts. While it’s theoretically possible, it would require connectDaily to constantly re-calculate the available resources while you’re editing the event. Each time a date/time/recurrence field is changed, the available resource set would have to be recomputed. With pooled resources this is even more complicated because we have to find ALL of the conflicts (as opposed to just finding one) and compute the quantity in use at the time of the occurrence of the event. Even more complicated is that it’s possible for users to add resources BEFORE entering any dates or recurrence. So, potentially we have a problem where someone selects resources, then enters/changes date/time/recurrence information, invalidating already selected resources.

The second reason is that if you started adding your event, but didn’t save and went to lunch, when you return the number available might be different. What we’re saying is that even if we calculated the quantity available at the time you added the resource to the event, we can’t guarantee that quantity will be available when you hit the Save button. connectDaily could lock ALL resources when someone enters the edit event screen, but then only one person would be able to use the create event screen at a time. If someone opened the screen and went to lunch, all other users would be locked out.

The third reason is a little more subtle. When you select Save and connectDaily checks for resource conflicts, it’s usually between 1 and 4 resources that are being requested. If you have 100 resources in your system, then to speculatively check availability, connectDaily would have to check availability of not 1-4 resources, but ALL 100. Compounding this is the issue of recurring events. If you create an open-ended recurring event, connectDaily has to check out some period in the future to be reasonably sure there are no conflicts. So, this means that connectDaily would have to look at 100 resources over a period of 2-3 years, which could be potentially thousands of calendar events. If we check availability every time something in the date/time/recurrence pattern changes, we’re talking about doing this 4-10 times PER EVENT. The worst case will happen EVERY TIME you create a recurring event because each time, there will be some recurrence pattern without an end date. This would take a lot of computational power, and it would cause noticeable performance delays. Redesigning the edit event screen as a wizard could potentially reduce the number of checks to one at the cost of making it more difficult to edit events.

Finally, there’s one more issue left. Say for example, you create an event, and you want a specific room. connectDaily determines that room isn’t available at the time your event needs and doesn’t show the resource. When that happens, your most likely reaction would be to submit a support request to us because the desired room isn’t showing and you know it’s in the system. In order for you to be able to manage your facility, you need to be shown WHY the resource isn’t available which means showing you the conflicts.

Even though it might not make sense at first glance, from a user interface standpoint the best way to handle these issues is the way we’ve chosen . You can select the quantity needed for your event. When you attempt to save, we’ll tell you if that won’t work and why.

Resource Approval Notes

Resource approvals work as they always have. However, if the resource is approved and then the quantity is changed, then the following rule applies:

  • If the quantity used is increased, then the resource approval will be removed. The approvers for the resource will have to then re-examine the resource usage and approve it.
  • If the quantity is decreased, then the resource approval will be left in place. If 12 laptops were approved for a class, but the number of students was decreased and the number of laptops was reduced to 10, then the approval would remain.

Wrapping It Up

connectDaily 5.0’s new pooled resource feature is a great addition to one of connectDaily’s best features. It allows you to have additional control over events you scheduled. Your facilities staff will really appreciate the additional information that’s provided, AND the fact that resources won’t be over-booked